
This article is adapted from a talk I gave internally at Saleswhale. It's part of an experiment to "build in public" - and document our journey from $1M to $10M in annual recurring revenue. It's not about marketing. It's about setting the right goals, which sounds incredibly boring... so read on at your own peril.
"It feels like everyone is pulling in different directions. People want to contribute to growth, but they don't know how."
My co-founder and CTO, Ethan, groaned during one of our catch ups in early 2020.
For the longest time at Saleswhale, we didn't have proper goals.
The only goal was to grow revenue. If we hit revenue goals for the month, good. If not, panic - and start an inquiry!
We moved ahead in assorted (often random) directions. We would launch features and new initiatives constantly. A significant number of projects had no impact on growth.
Still, we managed to get from $0 to $1M in ARR within 2 years of launch.
But, as we continued to grow the company, we started to lose momentum.
Teams would be spending time on stuff that honestly just didn't matter to the overall business.
Features were shipped that did not move the needle on business metrics.
The engineering and design teams over-rotated to building internal tooling and improving the system for "scalability".. while our customers were screaming about feature gaps.
There was a lack of focus across the commercial teams.
Misalignment ensured as teams were siloed off, pulling in different directions. Each optimizing for their own metrics, and their own perception on "how best to help the company".
I knew then, that if we continued like this, we were going to struggle to get to $10M in annual recurring revenues.
So, what's the problem with optimizing for revenue as The Metric That Matters?
In the words of Paul Graham, growth is a "bewildering multifarious problem". Choosing revenue as the metric to optimize for just exacerbates this problem.
Here's why:
Financial metrics doesn't capture the relationship between business problems that customers hire Saleswhale for... and the revenue that we generate as a by-product of solving this problem.
"Just grow revenues" is such a broad and nebulous goal, that it's hard to drive clarity and alignment across the company to support it. Especially for product and engineering teams. (Do you build a custom, one-off feature for a customer that offers to pay you $200,000 a year for it? If you are just optimizing for revenue, you should.)
It's a lagging indicator of product and go-to-market impact - and often, by the time revenue is impacted, it's too late to make changes. (When a customer churns, the decision is usually made internally months in advance, especially if you sell annual contracts.) [1]
To tackle this problem, I sat down and wrote down the things I wanted to solve for.
I needed a mechanism to:
Give the entire company clarity and alignment - what should we optimize for, what can be traded off?
Allow teams to use this mechanism to communicate impact and progress, and to be held accountable to
And most importantly, this mechanism has to be tied to the value we were driving for our customers
What would such a mechanism look like? Here's what I realized I needed:
First part: a non-revenue compass metric to drive towards
Second part: a way to operationalize it and drive accountability
As a reference, I looked to AirBnB's compass metric in the early days, which was "Nights Booked".
People who are more cynical may ask, "Isn't Nights Booked pretty much just revenue?"
The answer is no.
Here's what I looked for in a good compass metric:
1. It has to track realized value for our customer (especially for an anti-usage product like Saleswhale)
2. It has to represent the core of our current product strategy and vision
3. It has to be a reliable leading indicator of future revenue
To get this compass metric for Saleswhale, I started with intuition, and then started data spelunking.
An immediate insight
An interesting insight that jumped out almost immediately at me: customers who successfully integrated us with their Salesforce CRM instance almost never churn (seriously - zero churned historically over the years).
And these customers spent 4.45X more with Saleswhale on top of their original contract value on average (expansion revenue).
Now, first-order thinking may lead you to think - "That's your compass metric - number of teams integrated with Salesforce!"
Hold on a minute.
I was really interested in the second-order reasoning behind this -
Why?
Why are teams who were integrated with Salesforce more likely to become successful?
On further analysis, it came down to this: "realized value" usage patterns.
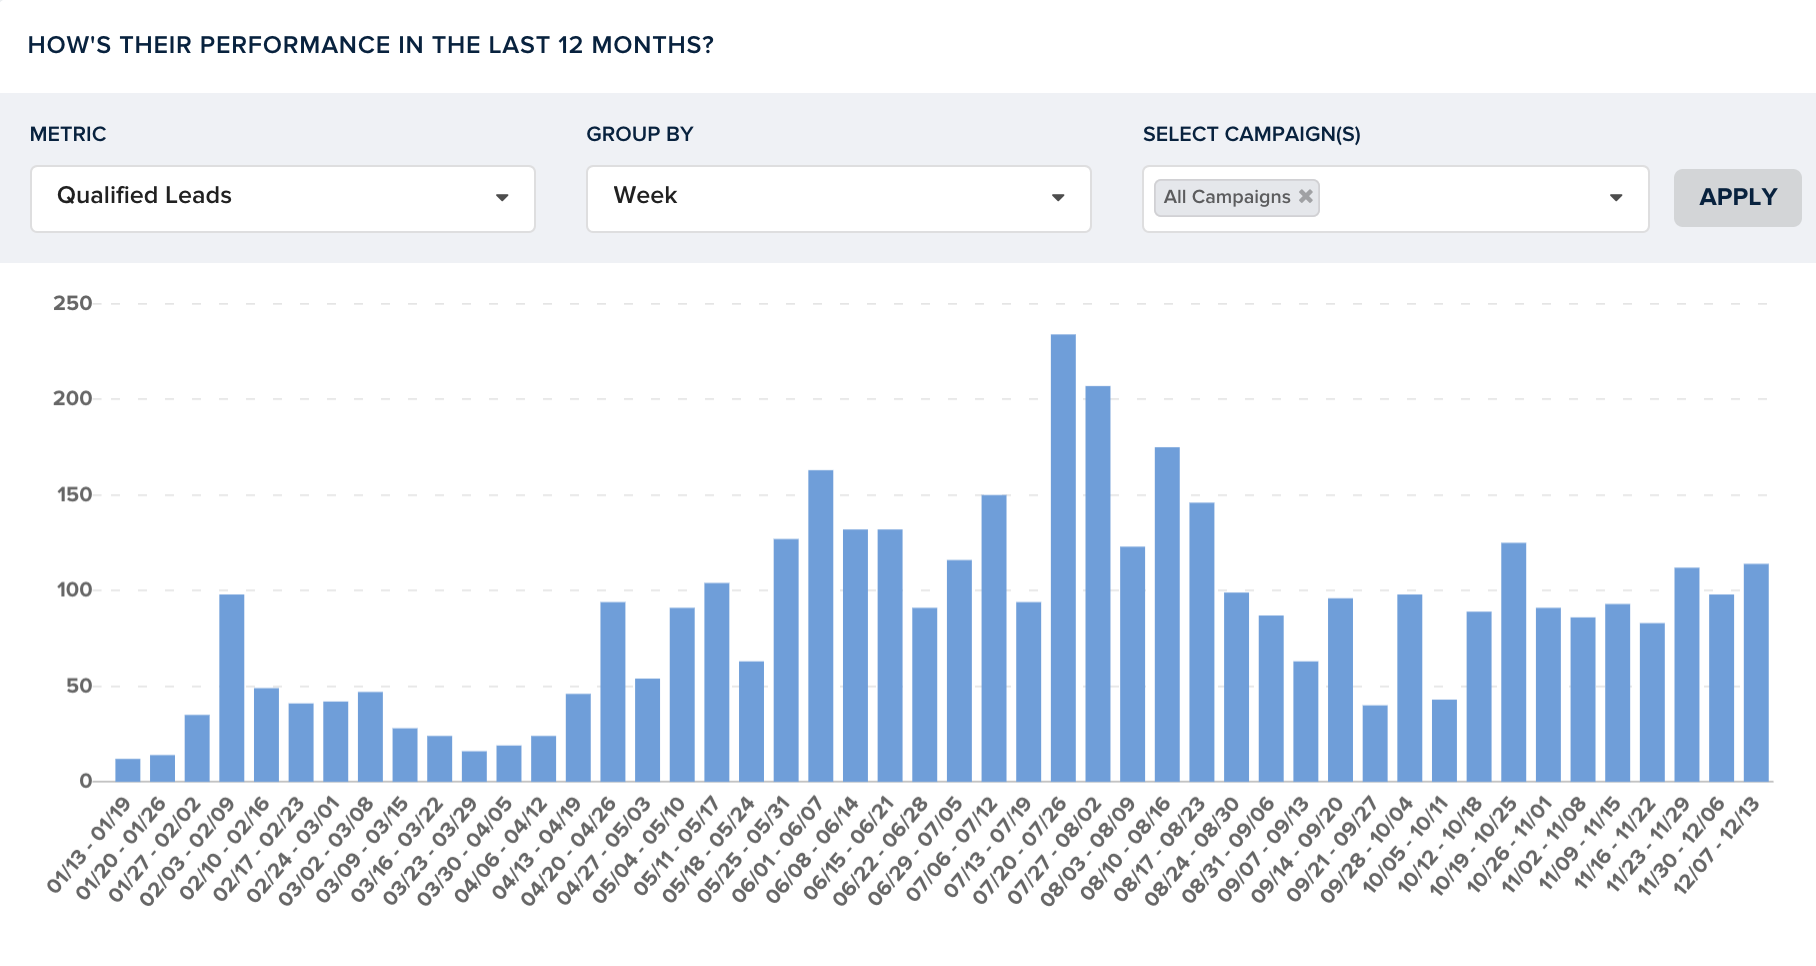
Here's a typical weekly "realized value" usage pattern of a team that was integrated with Salesforce:
Here's the typical "realized value" usage pattern of a team that is not integrated with Salesforce:
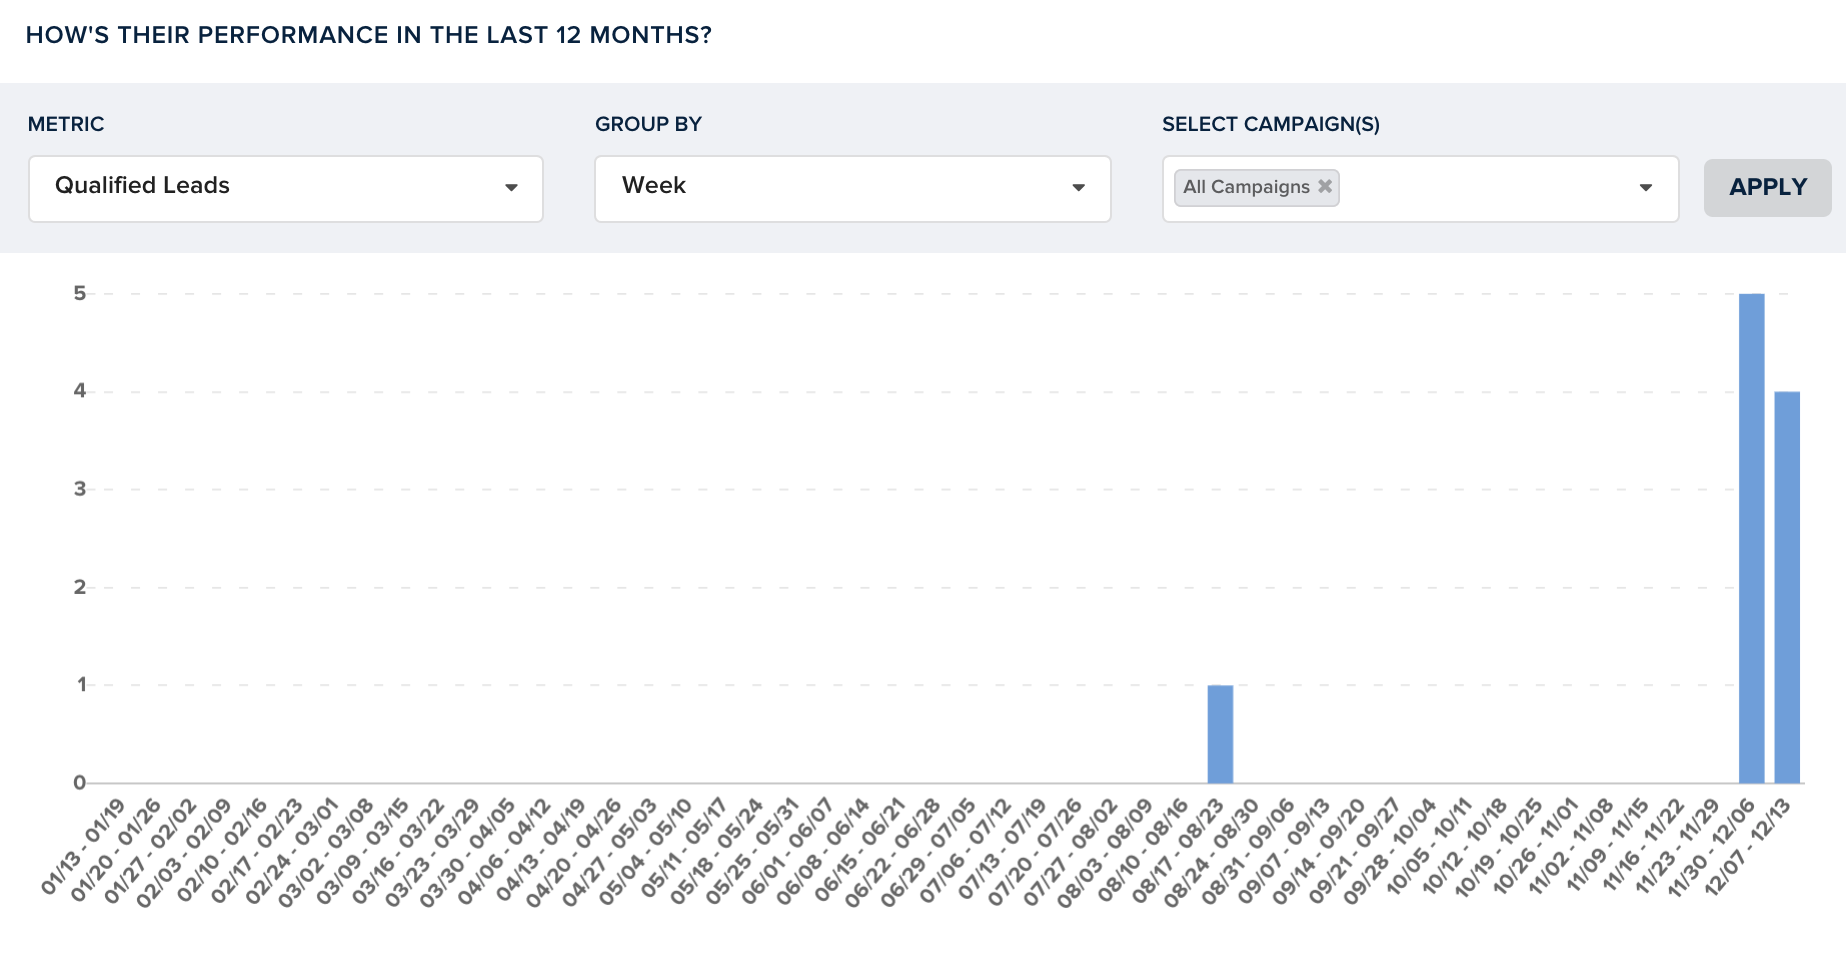
Once I saw this, I realized that our most successful customers shared this "realized value" usage pattern.
They didn't necessarily need to be integrated with Salesforce. They could be integrated with our API, with HubSpot, through Zapier, or just having a very disciplined approach to manually using the software well.
Salesforce integration, although useful as a starting point to finding our compass metric, was ultimately a red herring.
It turns out, all that mattered was: did they see at least 1 qualified lead per week on average? [2]
Measuring correlation
I then started to analyze customers who churned, as well as customers who retained/expanded against this hypothesis:
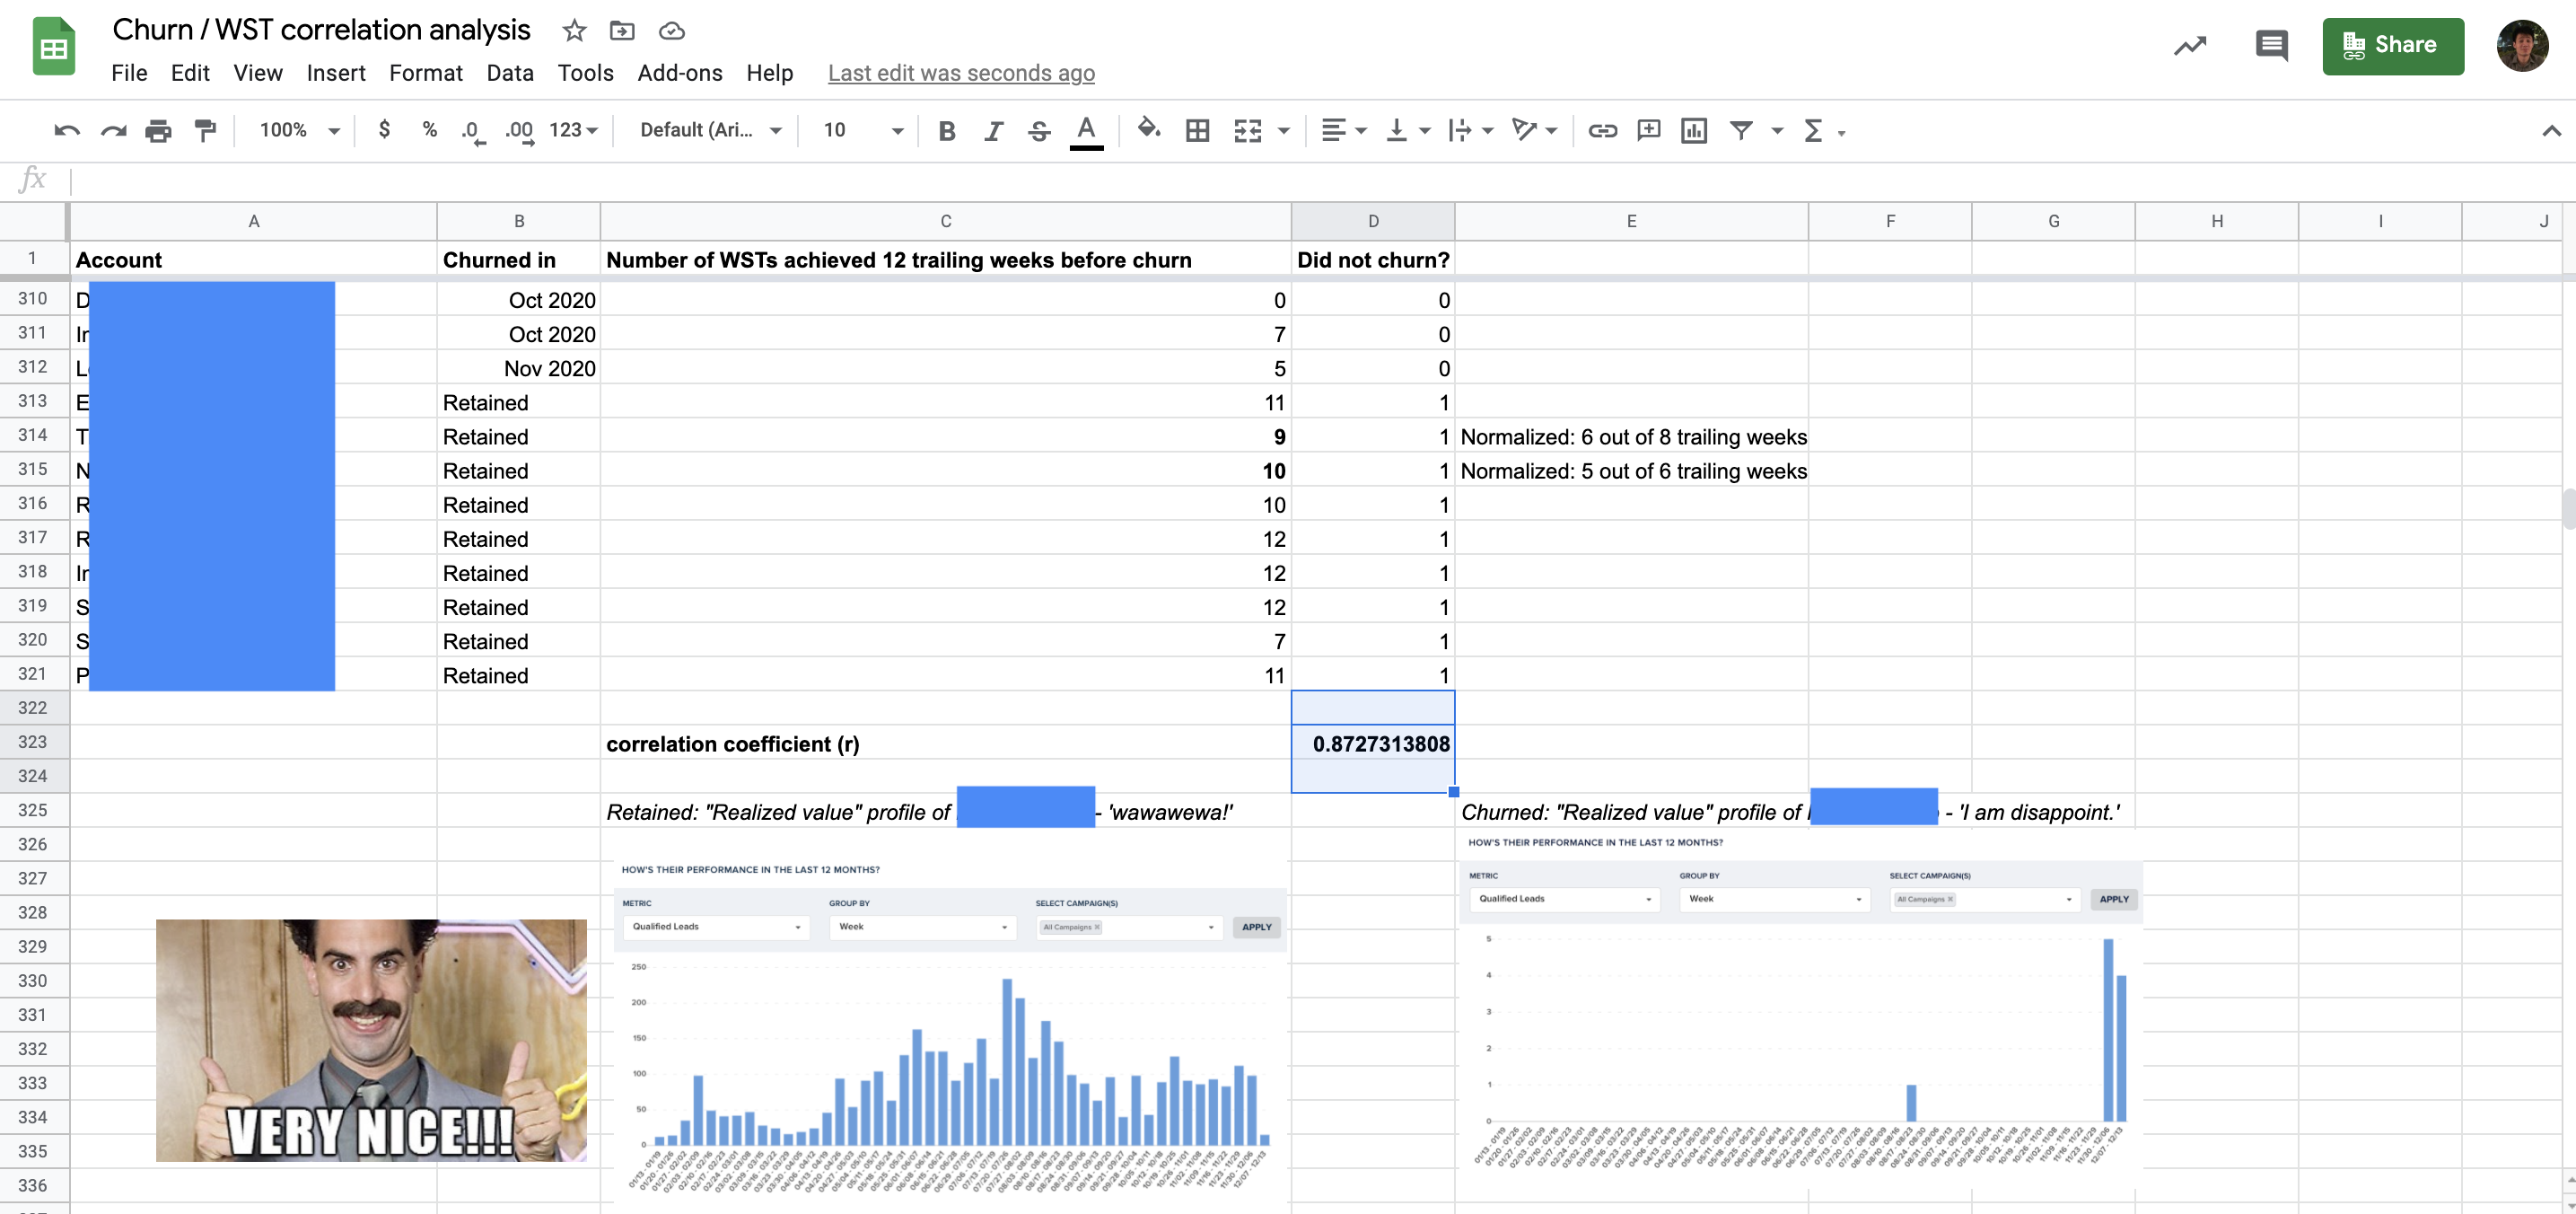 Metric showing a correlation co-efficient (r) of 0.87.
Danger ahead
Building a strategic narrative around the compass metric
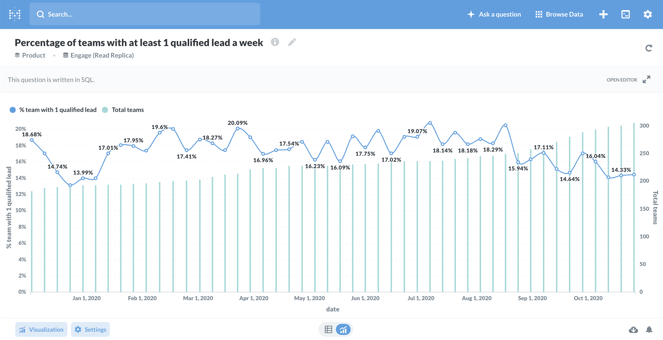
With this, I then started to build a narrative around this metric: Teams with at least 1 qualified lead per week.
Obviously, in retrospect, this compass metric makes sense - because it was correlated to revenue that we generated for our customers (>$100M in revenue generated for all our customers to date).
So now, the question becomes - how do we make the chart below tilt even further?
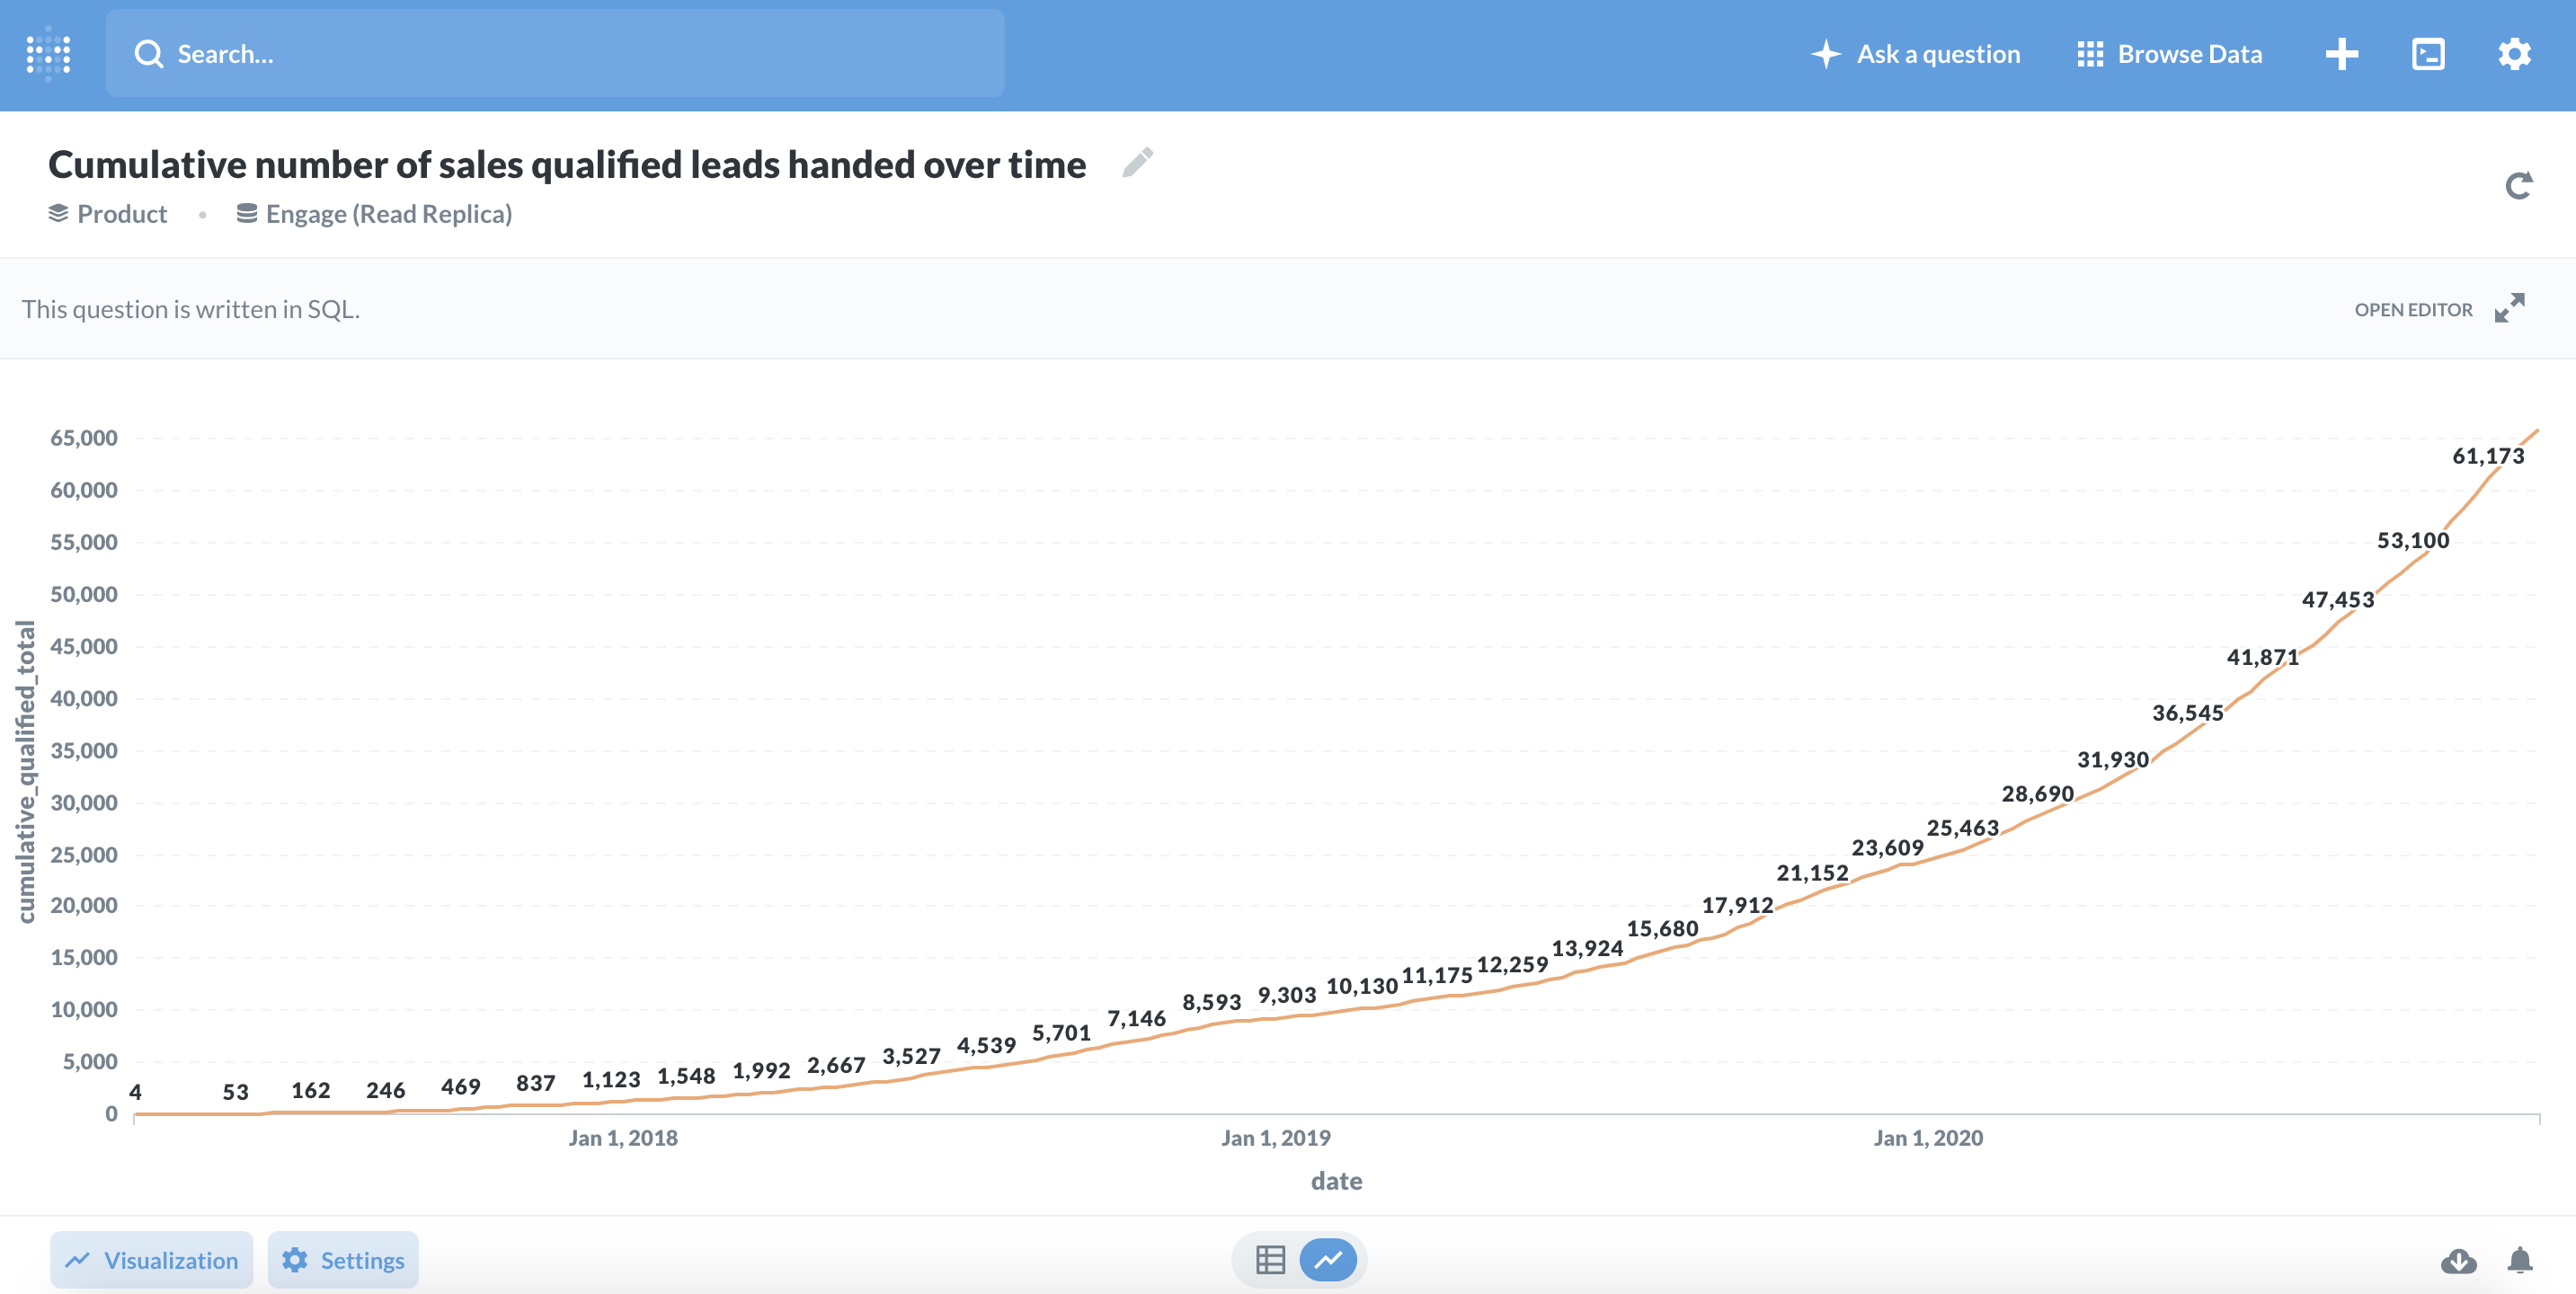
The answer is to find a way to operationalize this insight.
1. Rally the team around Mission-to-Metrics
There is a parable about bricklayers. It goes like this -
A traveler came upon three men working. He asked them what they were doing.
The first man said, "I am laying bricks."
The second man said, "I am putting up a wall."
The third man said, "I am building the world's most beautiful cathedral, so people can come together to pray."
One of the jobs of a leader is to create purpose and alignment for the people who work for them. To make sure that people understand how their work fits into the broader goals. And to do it in a way that's clear, simple and inspiring.
This is much harder than it sounds. [3]
How do you help the team internalize this, and not just lay bricks randomly?
What has made it easier for me, is by drawing a diagram of our Mission (purpose), Strategy (direction), and Metrics (cadence and performance).
You can see it in the diagram below, with sensitive information redacted.
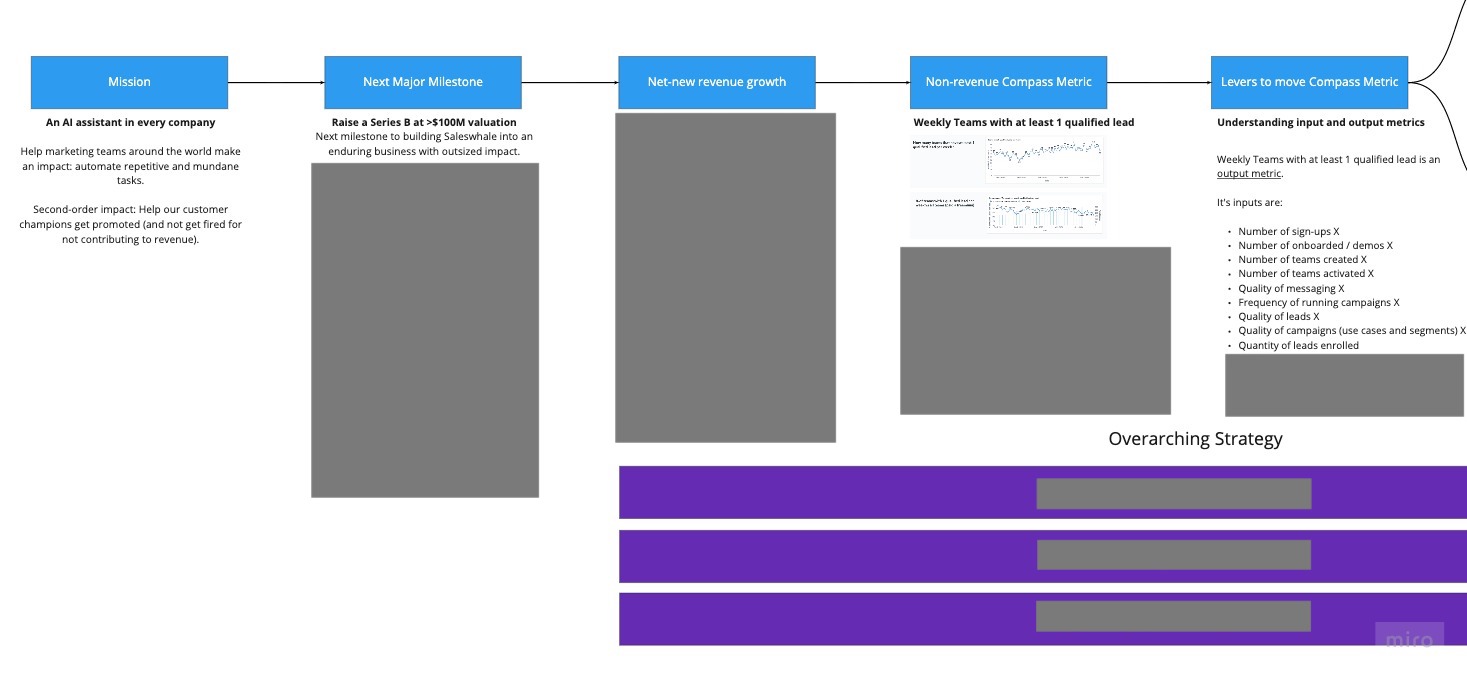
.jpg)
A simple practice always seems to help: getting my thinking out on paper (or on Roam, or Miro). Doing so helps me be more through and catch flaws in my thinking.
I stress-test this with my leadership team, and a few trusted advisors to get the kinks out.
Then the hard part: communicating it with the company regularly, and repeating our Mission-to-Metrics much more than what feels reasonable.
The goal is to make sure that people can make good decisions that align with the overall goals based on the context provided.
2. Help people understand output versus input metrics; levers to move compass metric
It's important to differentiate between output and input metrics.
Output metrics = results.
Input metrics = actions that influence the output metric.
Teams with at least 1 qualified lead per week is an output metric (revenue is an outcome).
You can't get people to execute against output metrics. They are too big, too broad, and not actionable.
An analogy would be the scoreboard in a football game.
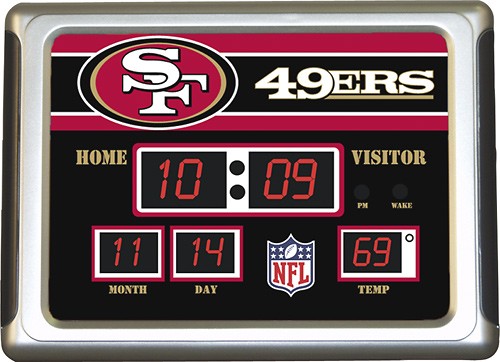
You can't just tell the team to "go move the number on the scoreboard". They are going to be confused and misaligned - and you won't keep your job as head coach for long.
To win the game, you need to organize your team around plays that drive the score.
In other words, you need to break down output metrics into input metrics which teams can directly influence.
.jpg?width=1311&name=2021%20Planning%20(2).jpg)
Example scenario: Saleswhale's Customer Success team output metric
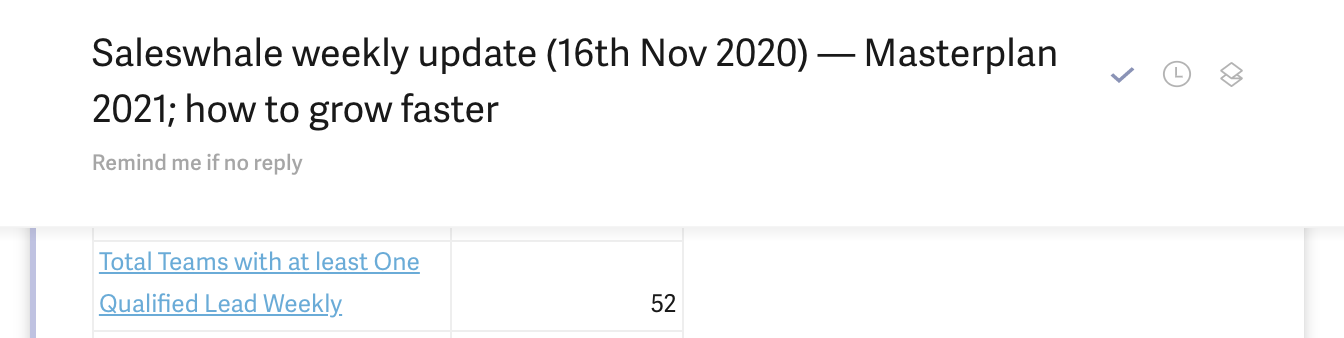
Here's an example scenario for our customer success team. We know that teams which see at least 1 qualified lead per week are more likely to churn less, spend more, and advocate for us via word of mouth.
And yet, historically, only 15% of teams which use Saleswhale would hit this vaunted metric. The problem is worsening as we continue to accelerate adding new customers - the growth spurt dilutes the pool of "weekly successful" teams.
If you were working at Saleswhale, and trying to brainstorm ideas to increase the number of teams that achieve at least 1 qualified lead a week, you will quickly realize that it's not productive. It's simply too broad a goal, with a dauntingly large surface area to start attacking from.
You will need to break this metric down into discrete layers of input metrics.
You would start by asking yourself - "what are the top-level input metrics for an existing customer to become a 'weekly successful' one?"
And you will get the equation:
Teams with at least 1 qualified lead per week = Number of teams activated X Quantity of campaigns created X Frequency of campaigns ran X Quantity of leads enrolled X Quality of leads enrolled X Quality of messaging X Quality of campaign segmentation and use cases etc. etc.
.jpg?width=1192&name=2021%20Planning%20(5).jpg)
Now, you can break these options down even further. You can start to identify the different bets you can undertake to move one of these levers.
.jpg?width=1180&name=2021%20Planning%20(3).jpg)
It can be tempting to work on every single lever.
But at Saleswhale, we prize the ability to prioritize and focus.
You can only choose one input metric to move each 6 week sprint. Which is it going to be? Why do you feel that this metric is the most impactful metric to try to move, with the current priorities, resources, and constraints?
When each team presents their initiatives, we run them through a framework jointly created by my Head of Growth, and Chief of Staff. Some of the questions that are asked in the framework:
3. Accountability cadence
Choosing your compass metric, mission-to-metrics, and helping people understand the inputs is a fraction of the battle.
The rest of the battle is to operationalize this in a way that affects day-to-day decision making and accountability.
Our internal goal is to reach 6% weekly growth, a pretty ambitious number.
To do this, I just rely on two scaffolds: one email, and one meeting a week.
The only question that matters is: did we make our 6% number for the week?
Every Tuesday, we have a quick compass metric + input metrics meeting. This meeting is attended by everyone who has a direct impact on the compass metric, including engineering, product, marketing, customer success etc.
The agenda is simple:
This is the cadence I use to run a venture-backed business worth tens of millions of dollars.
One email, and one meeting a week.
Everything else flows from that.
Conclusion
Compass metrics are not just numbers.
They should be a reflection of the vision/mission. They should force teams to think critically about what matters most. And to understand / weigh trade-offs and constraints that could hamper key priorities. Obviously, our assumption is that a laser focus on realized customer value will lead to revenue. Do that, and the revenue will follow.
The above being said, no metric is perfect.
But a "pretty good goal" to shoot towards is better than "no goal at all".
My belief is that if you have a goal that's somewhat correlated to revenue, and everyone can answer "what are our goals for the quarter/month/week" independently, we are bound to at least make some progress towards our end results.
As Calvin French-Owen, co-founder of Segment says,
"At the end of the day, every successful billion-dollar business is just the sum total of many small deltas."
[1] Revenue retention is the outcome of customer realized value.
An example: our Customer Success team are trying to improve retention. But if they only track revenue retention, the game is over before they even had a chance to play. A lot of churn reasons by customers are post-hoc and not entirely candid.
[2] Obviously, magnitude matters too. All things being equal, it's better to have a customer see 12 qualified leads a week, than 1 qualified lead a week. But many of our customers were not even seeing at least 1 qualified lead a week - so I felt it was better to solve for that first.
[3] Arguably, I've failed at doing so well, over the last few years running Saleswhale.
I tend to rotate towards complexity.
I like to touch a lot of things that altogether are messy, but have a systematic approach to understand and lever an outcome that's bigger than each one of them.
I'm one of those people who likes to set up complicated end-games in strategy games and poker - which is spectacular when it works out, but fails 70% of the time.
You can't run a company this way.

Automate your conversion of neglected leads into sales meetings. No favors from your sales team required.


Co-founder & CEO at Saleswhale
Sign up for cutting edge ideas on conversational marketing, AI assistants and martech.
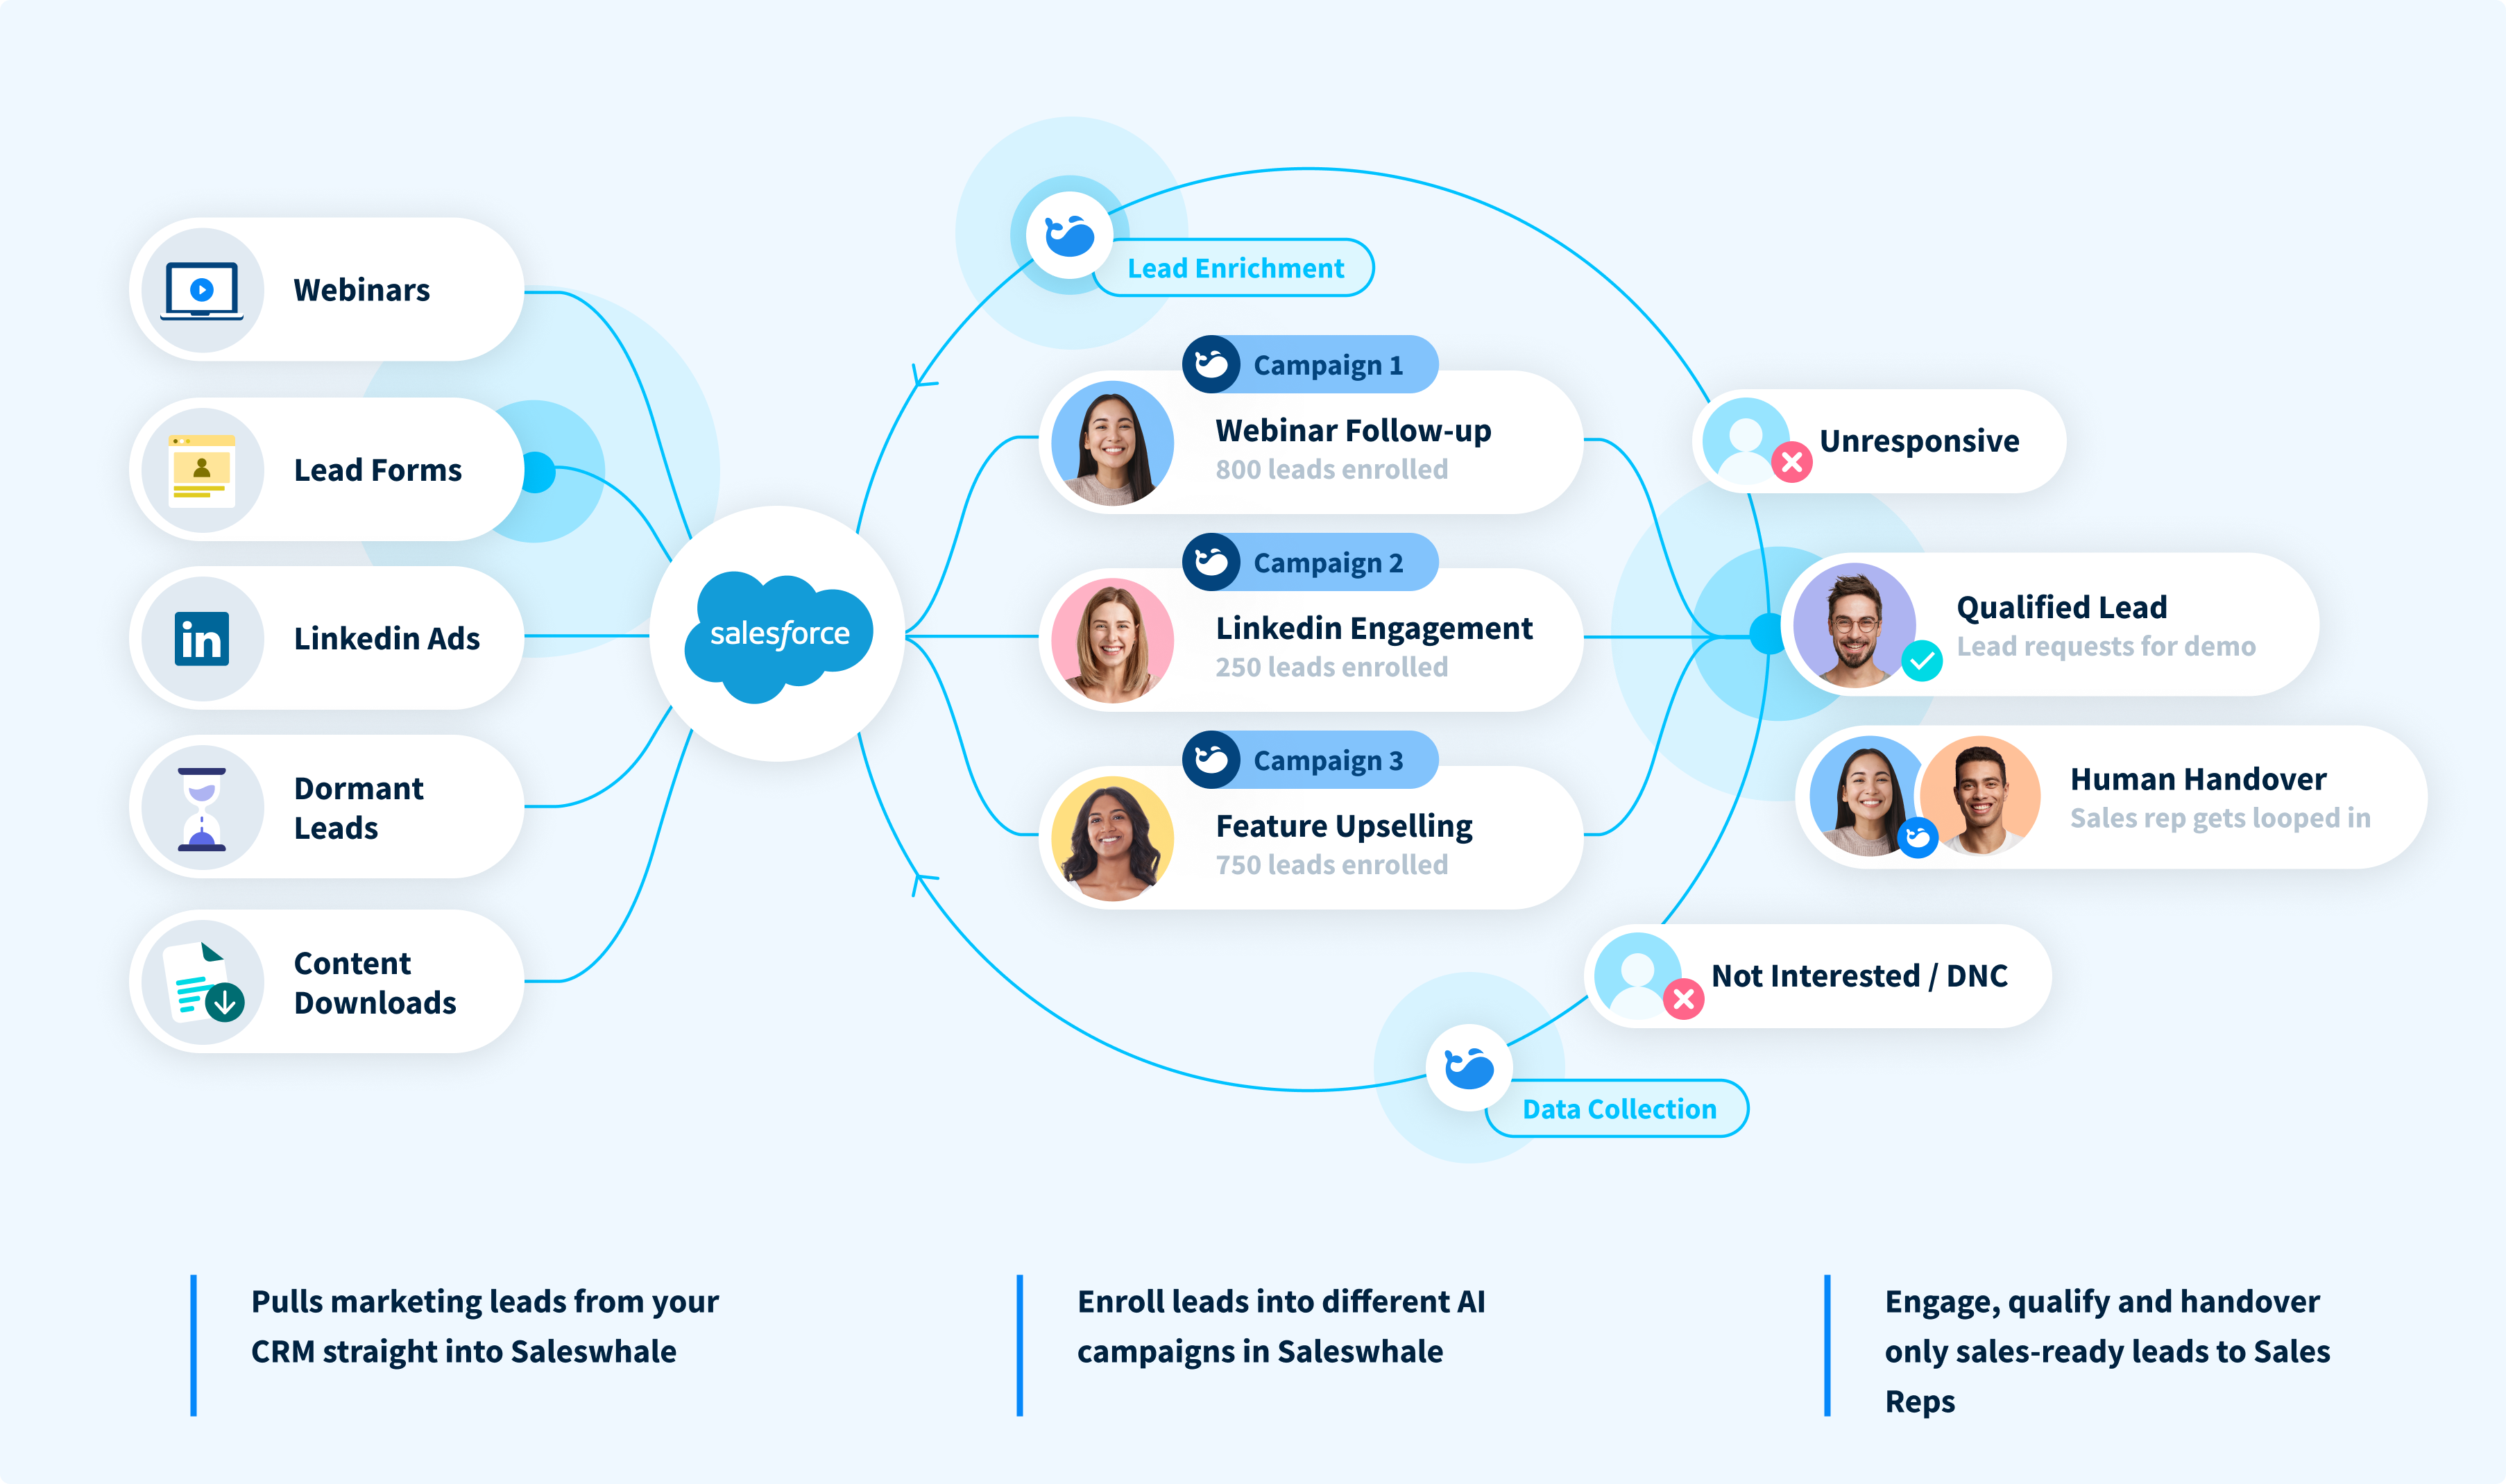
Saleswhale for Salesforce allows you to build powerful automated lead conversion workflows. This allows you to re-engage with your neglected marketing leads at...
19 APR 2021
Demand generation and marketing teams generate more leads at the top of the funnel than ever in this new digital-first world. Saleswhale helps ensure those...
1 MAR 2021

Marketers that focus on MQLs end up doing the wrong things in order to achieve the metrics. So I changed it.
16 JUN 2020
Conversica isn't the only player out there. Learn how Saleswhale and Exceed.ai compare and make an informed decision.
15 APR 2021
